matplotlib绘图分析
解释:
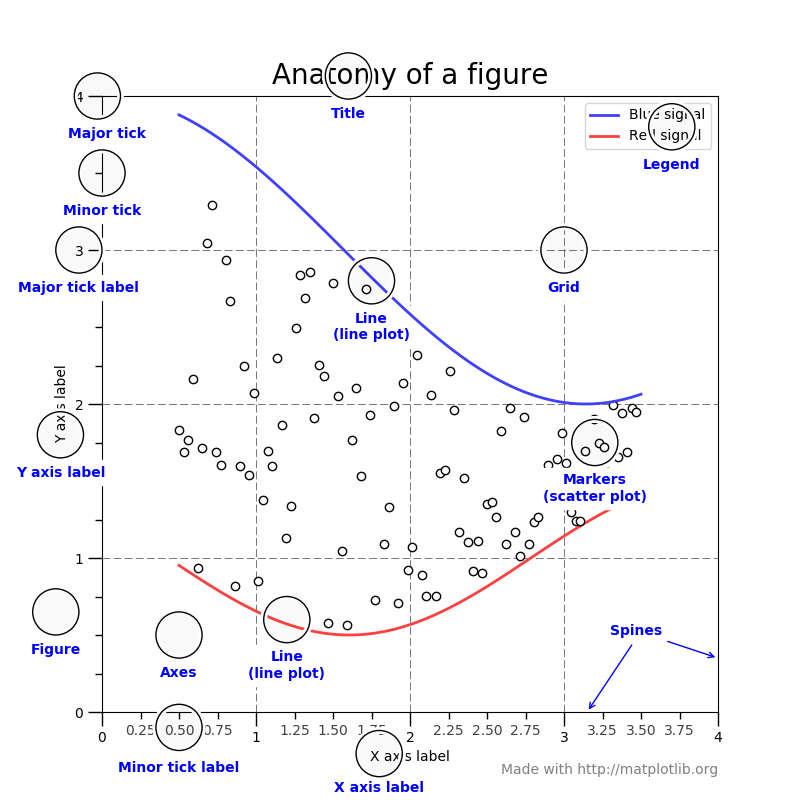
Figure:图形绘制的画板,他就相当于一个黑板,所有的图都是绘制在Figure上面。Axes:每个图都是Axes对象。一个Figure上可以有多个Axes对象。Axis:x轴、y轴的对象。Tick:x轴和y轴上的刻度对象。每一个刻度都是一个Tick对象。TickLabel:每个刻度上都要显示文字,这个文字的显示就是在TickLabel上。AxisLabel:x轴和y轴的名称的文字显示。Legend:图例对象。Title:Axes图的标题对象。Line2D:绘制在Axes上的线条对象,比如折线图等。Reactangle:绘制在Axes上的矩形对象,比如条形图等。Marker:标记点,比如绘制散点图上的每个点就是这个对象。Artist:只要是绘制在Figure上的元素(包括Figure),都是Artist的子类。
一、Figure容器:
Figure容器是最顶层的容器,他几乎包含了这个图的所有对象。通过add_subplot和add_axes方法可以添加Axes对象,这两个方法添加的都是Axes及其子类的对象。添加完成后是存储在figure.axes中。示例代码如下:
In [156]: fig = plt.figure()
In [157]: ax1 = fig.add_subplot(211)
In [158]: ax2 = fig.add_axes([0.1, 0.1, 0.7, 0.3])
In [159]: ax1
Out[159]: <matplotlib.axes.Subplot instance at 0xd54b26c>
In [160]: print(fig.axes)
[<matplotlib.axes.Subplot instance at 0xd54b26c>, <matplotlib.axes.Axes instance at 0xd3f0b2c>]
1.1. 添加Axes对象:
Figure只是一个黑板,如果想要绘图,需要先添加Axes。添加Axes可以通过add_axes和add_subplot来实现。示例代码如下:
# 创建一个figure对象
fig = plt.figure()
# 添加一个Axes
ax1 = fig.add_subplot(211)
# 添加一个Axes,其中参数是left,bottom,width,height
ax2 = fig.add_axes([0.1,0.1,0.8,0.3])
1.2. 操作当前Axes对象:
可以通过figure.gca以及figure.sca来设置和获取当前的axes对象。示例代码如下:
fig = plt.figure()
ax1 = fig.add_subplot(211)
ax2 = fig.add_axes([0,0,1,0.3])
print(fig.gca())
print(fig.sca(ax1))

>> Axes(0,0;1x0.3)
>> AxesSubplot(0.125,0.536818;0.775x0.343182)
1.3. 删除Axes对象:
Figure上的所有Axes对象都是保存在fig.axes中,但是如果想要删除某个Axes对象,那么必须通过delaxes来实现:
fig = plt.figure()
ax1 = fig.add_subplot(211)
ax2 = fig.add_axes([0,0,1,0.3])
fig.delaxes(ax1)
print(fig.axes)
1.4. 获取所有的axes:
for ax in fig.axes:
    ax.grid(True) # 设置打开网格
1.5. Figure的属性有如下:
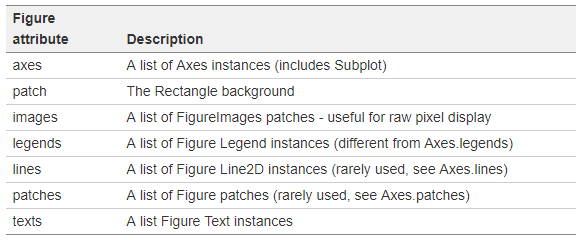
Figure类定义介绍:https://matplotlib.org/api/_as_gen/matplotlib.figure.Figure.html#matplotlib.figure.Figure
二、Axes容器:
Axes容器是用来创建具体的图形的。比如画曲线,柱状图,都是画在上面。所以之前我们学的使用plt.xx绘制各种图形(比如条形图,直方图,散点图等)都是对Axes的封装。比如plt.plot对应的是axes.plot,比如plt.hist对应的是axes.hist。针对图的所有操作,都可以在Axes上找到对应的API。另外后面要讲到的Axis容器,是轴的对象,也是绑定在Axes上面。
Axes的类定义介绍:https://matplotlib.org/api/axes_api.html#matplotlib.axes.Axes
2.1. 设置x和y轴的最大值和最小值:
设置完刻度后,我们还可以设置x轴和y轴的最大值和最小值。可以通过set_xlim/set_ylim来实现:
fig = plt.figure()
axes = fig.add_subplot(111)
axes.plot(np.random.randn(10))

# 设置x轴的最大值和最小值
axes.set_xlim(-2,12)

# 设置y轴的最大值和最小值
axes.set_ylim(-3,3)
2.2. 添加文本:
之前添加文本我们用的是annotate,但是如果不是需要做注释,其实还有另外一种更加简单的方式,那就是使用text方法:
data = np.random.randn(10)
fig = plt.figure()
axes = fig.add_subplot(111)
axes.plot(data)
# 添加文本,比annotate更加方便
axes.text(0,0,"hello")
2.3. 绘制双Y轴:
fig = plt.figure()
ax1 = fig.add_subplot(211)
ax1.bar(np.arange(0,10,2),np.random.rand(5))
ax1.set_yticks(np.arange(0,1,0.25))
ax2 = ax1.twinx() #克隆一个共享x轴的axes对象
ax2.plot(np.random.randn(10),c="b")
plt.show()
效果图如下:

三、Axis容器:
Axis代表的是x轴或者y轴的对象。包含Tick(刻度)对象,TickLabel刻度文本对象,以及AxisLabel坐标轴文本对象。axis对象有一些方法可以操作刻度和文本等。
3.1. 设置x轴和y轴label的位置:
fig = plt.figure()
axes = fig.add_subplot(111)
axes.plot(np.random.randn(10))
axes.set_xlabel("x coordate")
# 设置x轴label的位置为(0.-0.1)
axes.xaxis.set_label_coords(0,-0.1)
3.2. 设置刻度上的刻度格式:
import matplotlib.ticker as ticker
fig = plt.figure()
axes = fig.add_subplot(111)
axes.plot(np.random.randn(10))
axes.set_xlabel("x coordate")
# 创建格式化对象
formatter = ticker.FormatStrFormatter('%.2f')
# 设置格式化对象
axes.yaxis.set_major_formatter(formatter)
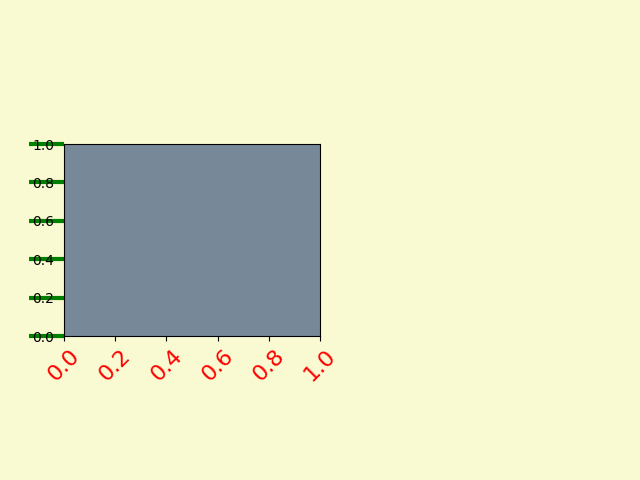
3.3. 设置轴的属性:
fig = plt.figure()

ax1 = fig.add_axes([0.1, 0.3, 0.4, 0.4])
ax1.set_facecolor('lightslategray')

# 设置刻度上文本的属性
for label in ax1.xaxis.get_ticklabels():
    # label是一个Label对象
    label.set_color('red')
    label.set_rotation(45)
    label.set_fontsize(16)

# 设置刻度上线条的属性
for line in ax1.yaxis.get_ticklines():
    # line是一个Line2D对象
    line.set_color('green')
    line.set_markersize(25)
    line.set_markeredgewidth(3)

plt.show()
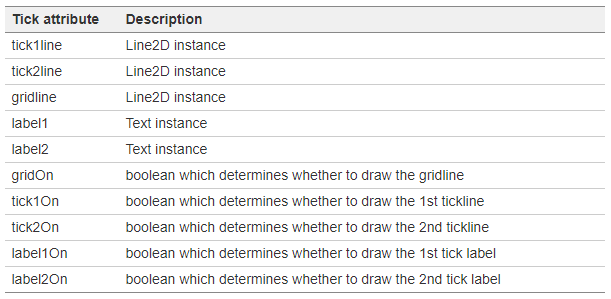
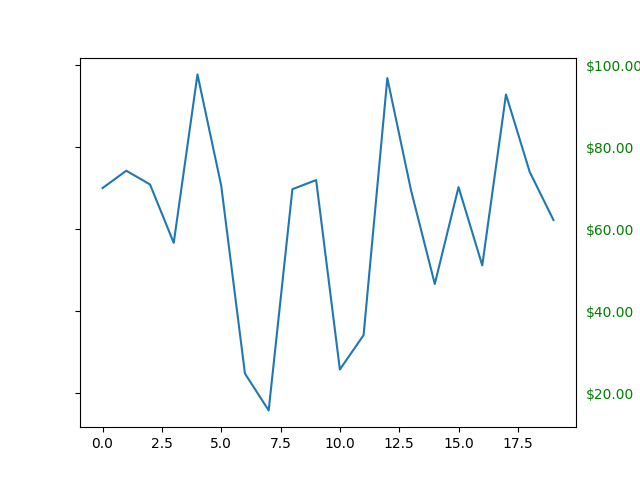
四、Tick容器:
Tick是用来做刻度的,包括刻度和网格对象。其中可操作的属性如下:
示例代码如下:
import matplotlib.ticker as ticker

# Fixing random state for reproducibility
np.random.seed(19680801)

fig, ax = plt.subplots()
ax.plot(100*np.random.rand(20))

formatter = ticker.FormatStrFormatter('$%.2f')
ax.yaxis.set_major_formatter(formatter)

for tick in ax.yaxis.get_major_ticks():
    tick.label1On = False
    tick.label2On = True
    tick.label2.set_color('green')

plt.show()
更多请参考:
https://matplotlib.org/api/axis_api.html#matplotlib.axis.Axis